Data
New Americans Data Jump to Refugee Services Data
Colorado's New American population estimate
The 2023 American Community Survey estimates that approximately 563,101 foreign born individuals live in and call Colorado home. This population represents 9.6% of Colorado's total population. Source: ACS Table S0501, 2023 1-year estimate
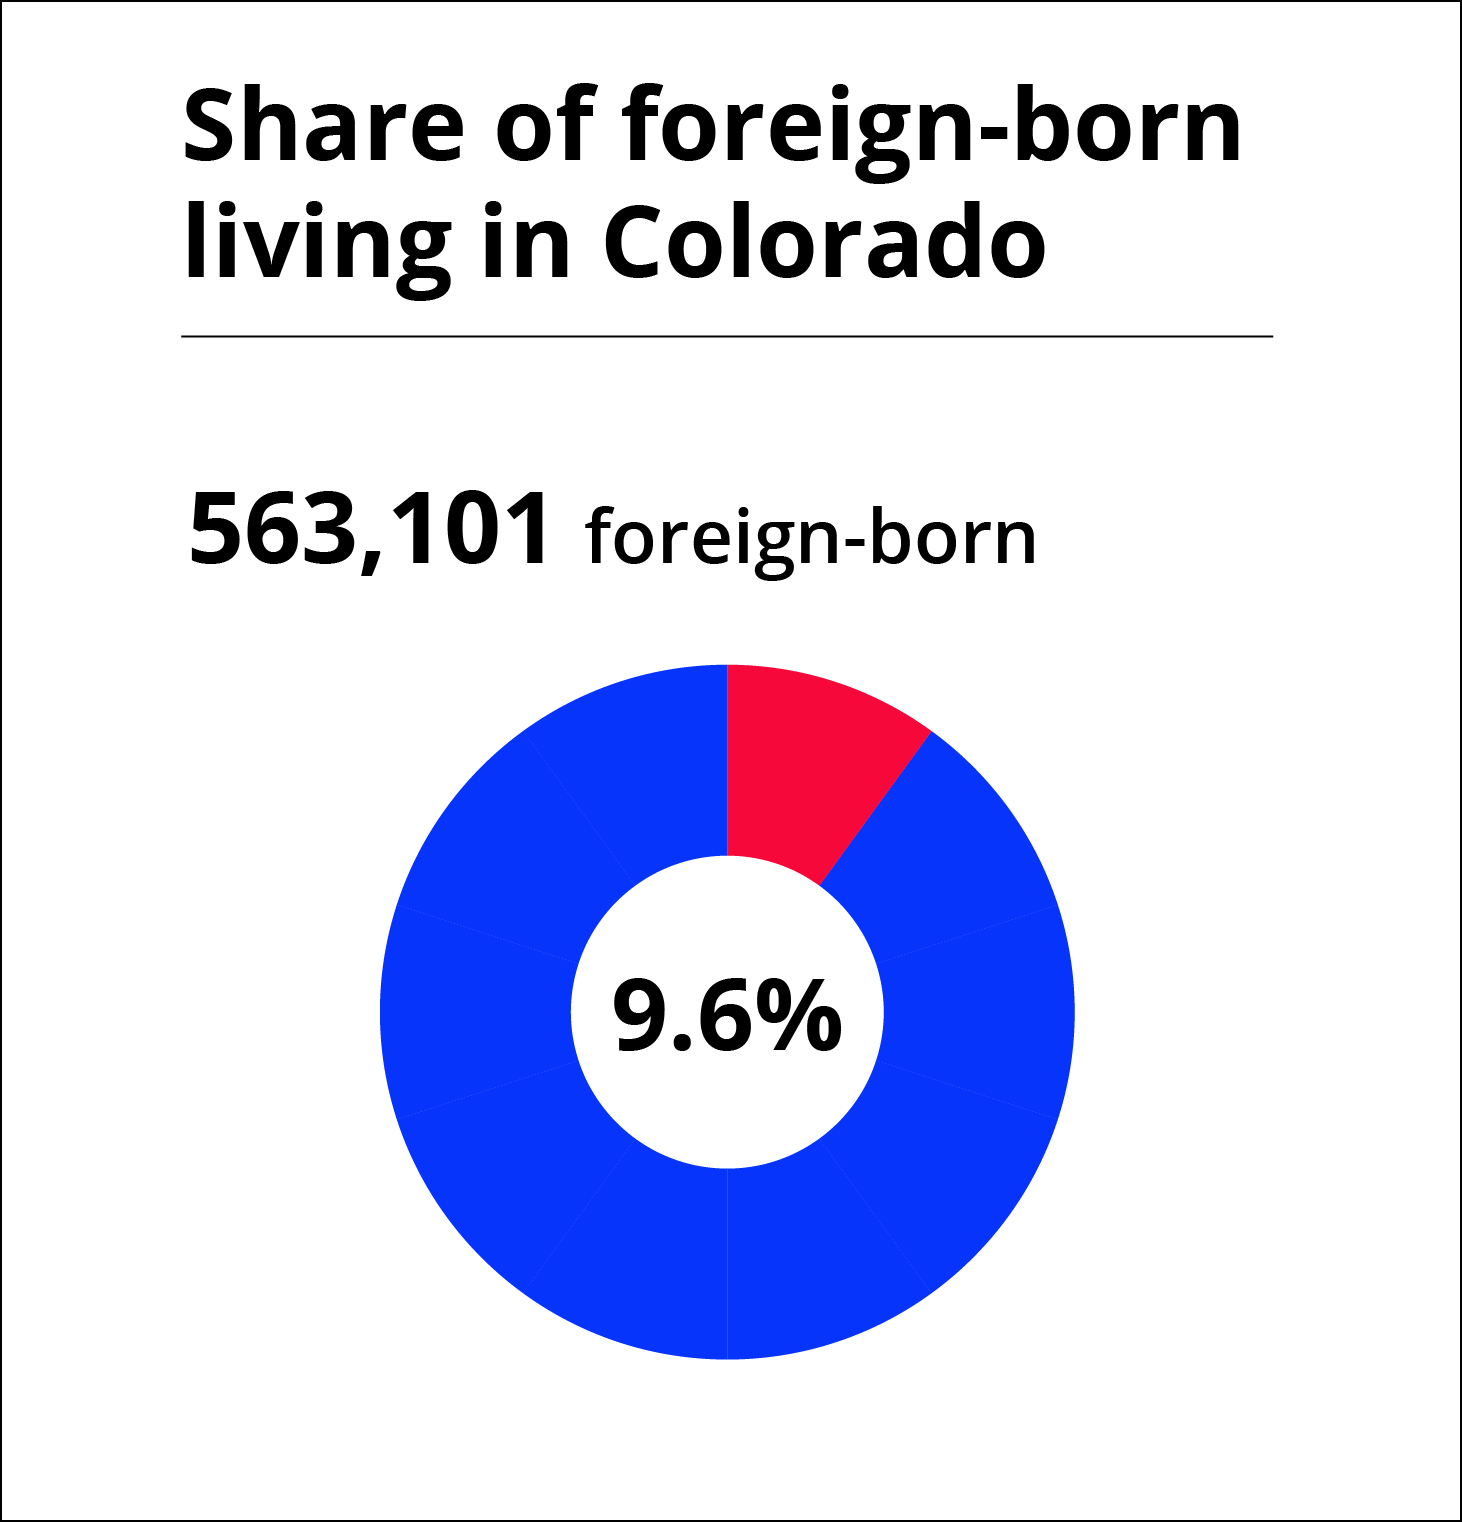
Pie chart showing share of foreign born living in Colorado - 563,101 foreign-born or 9.6%
Colorado's New Americans are of working age
A majority of foreign-born Coloradans are of working age. Currently, the Colorado workforce has two jobs available for every one available worker. Foreign-born Coloradans already play a significant role in Colorado's workforce and economy, and this talent pool will continue to play a role in addressing Colorado's significant workforce gaps. Source: ACS Table S0501, 2023 1-year estimate
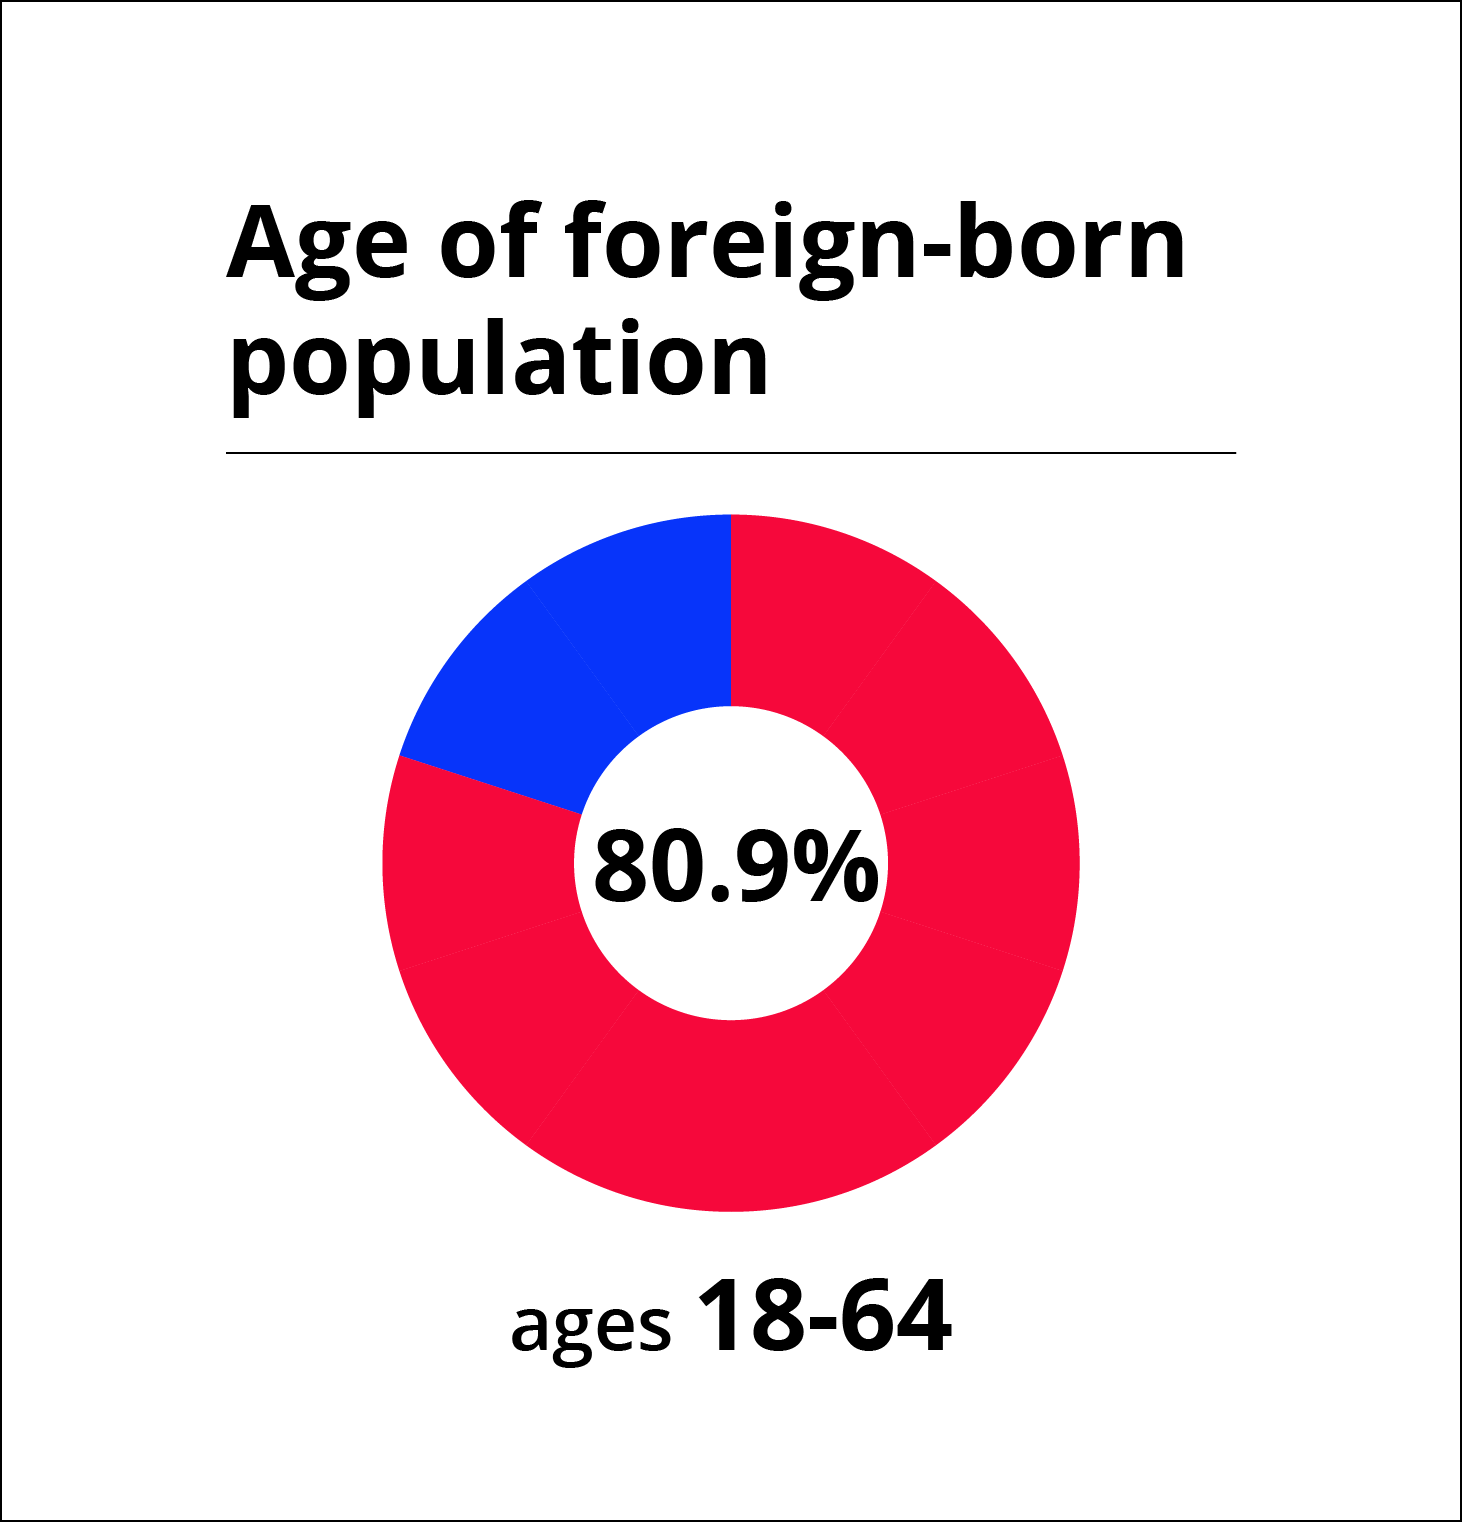
Pie chart showing age data of foreign-born population - ages 18-64 or 80.9%
Colorado's New Americans positively contribute to the economy
Foreign-born Coloradans significantly contribute to Colorado's economy. Foreign-born led households in Colorado hold an estimated $21.3 billion in spending power. These are dollars that reach Colorado businesses and the general economy. It is also estimated that foreign-born Coloradans paid $7.7 billion in taxes. Source: American Immigration Council
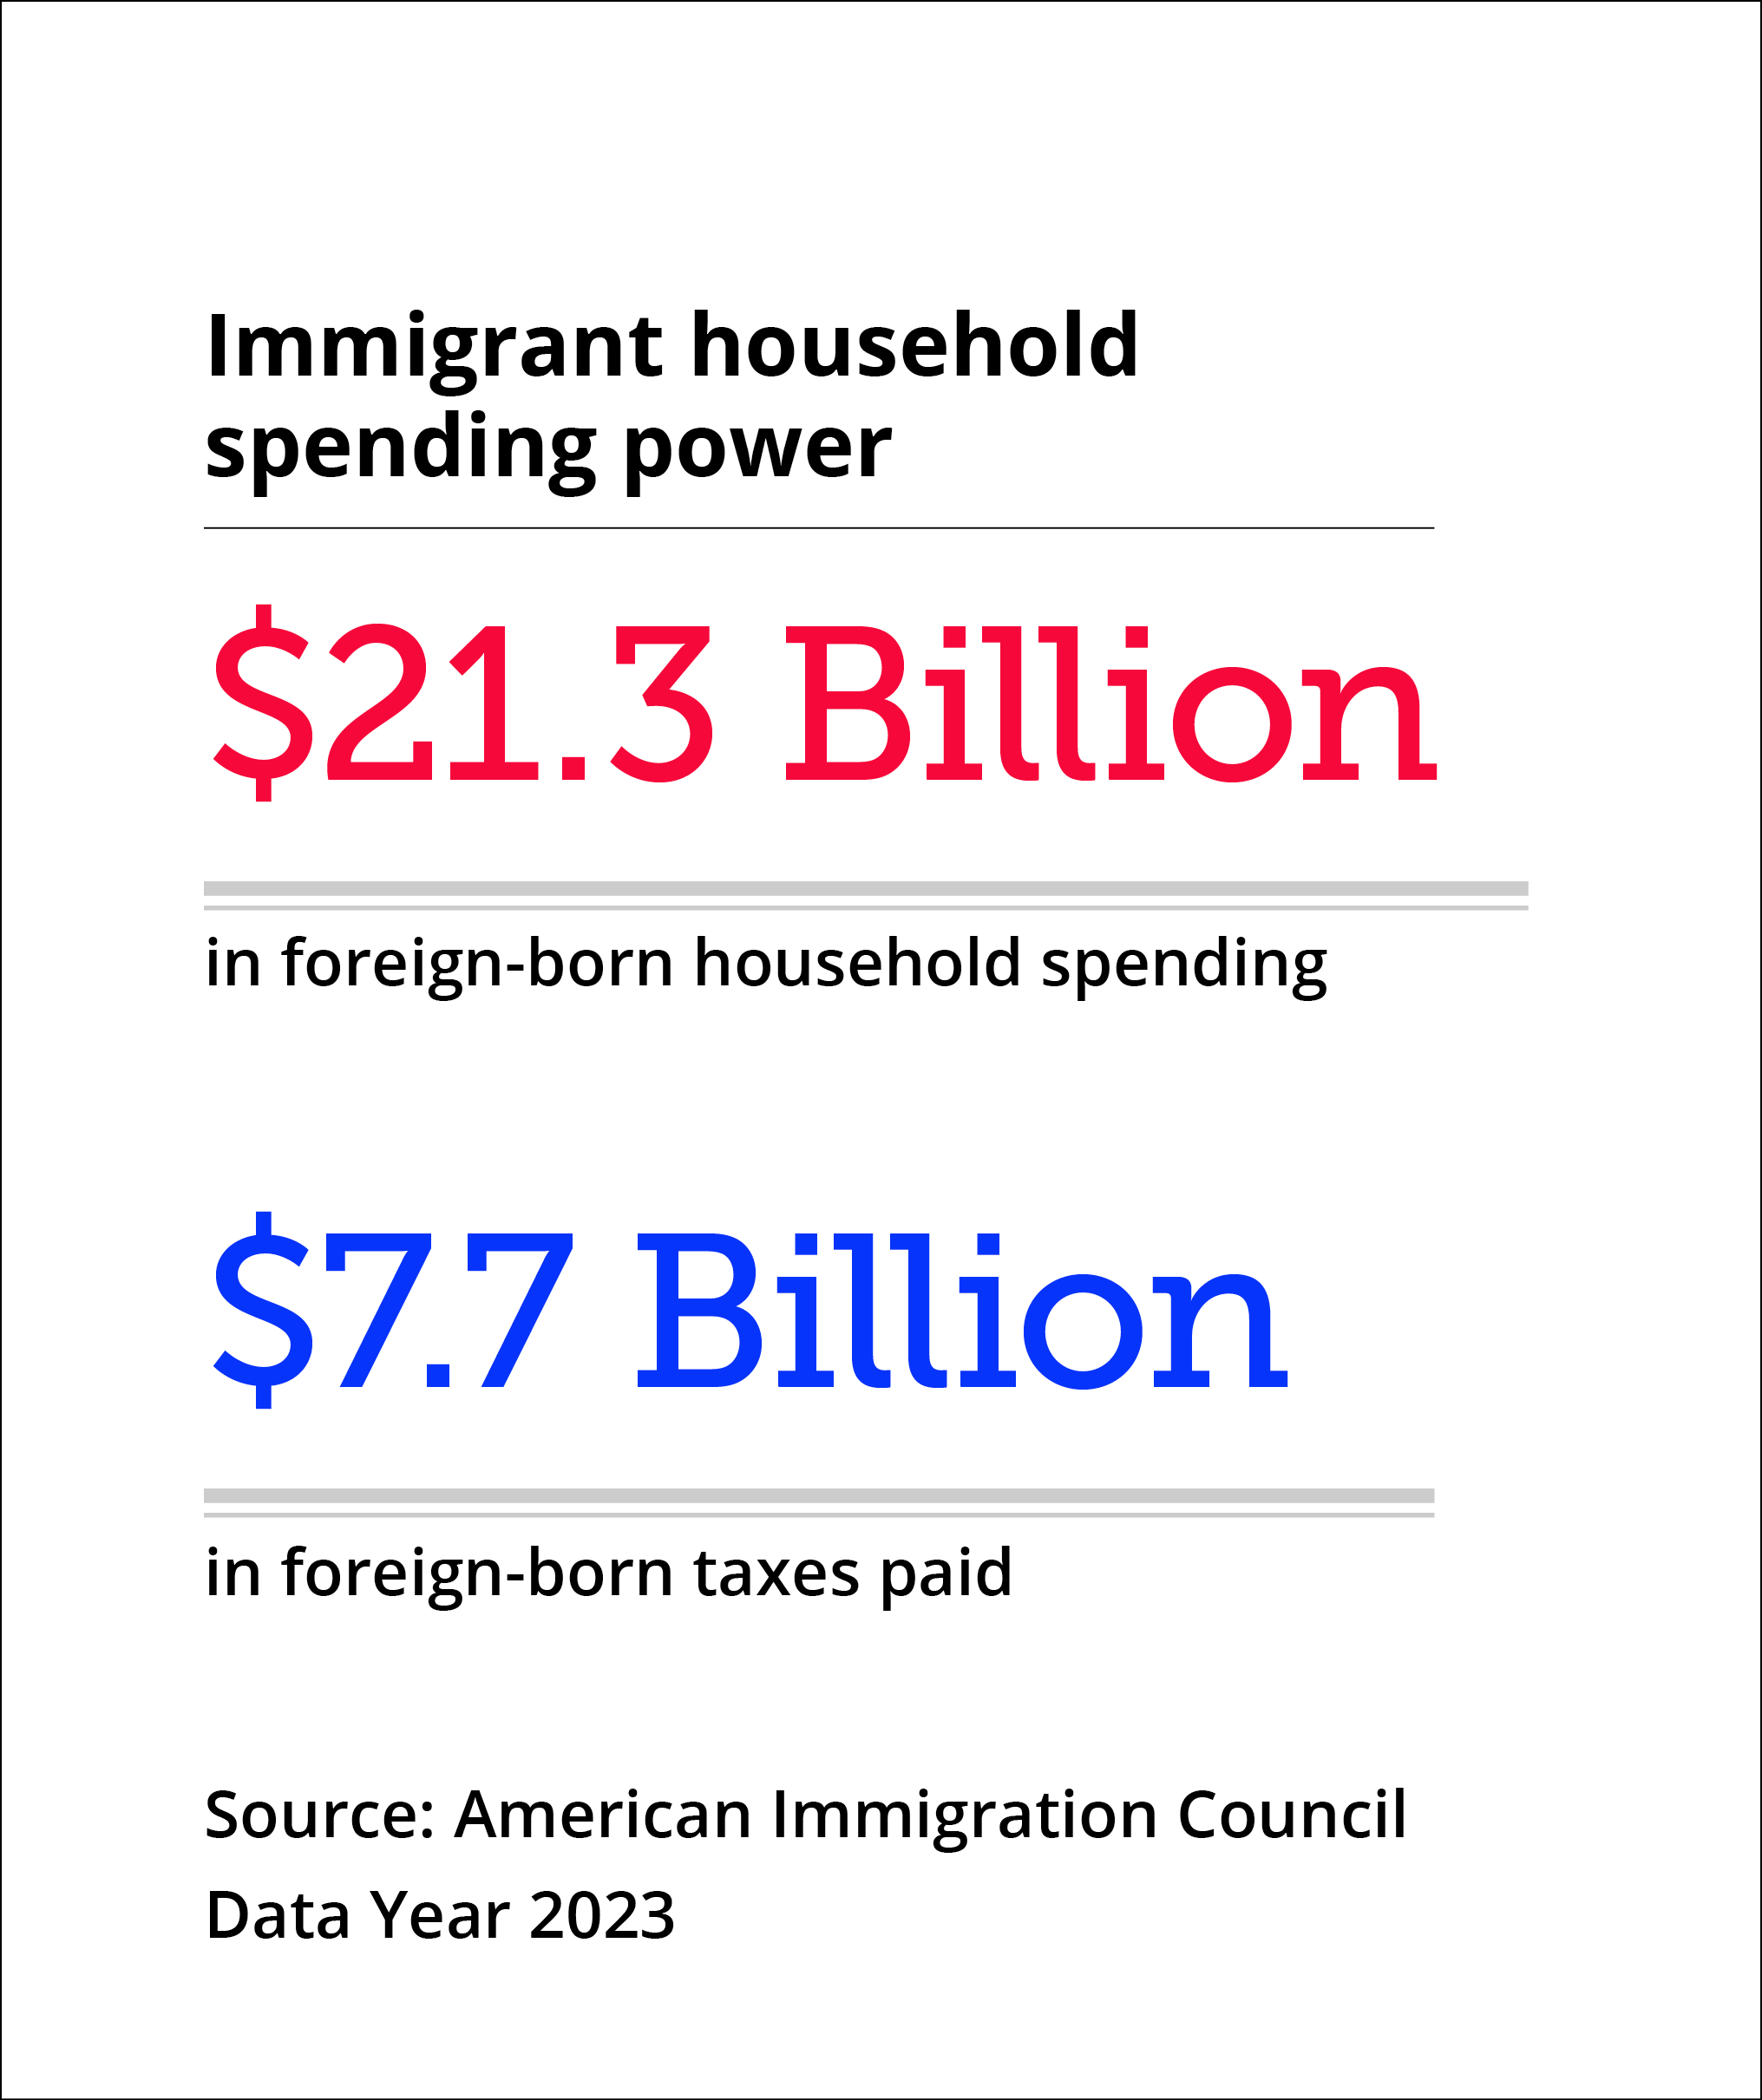
Text graphic showing immigrant household spending power: $21.3 billion in foreign-born household spending power. $7.7 billion in foreign-born taxes paid. Source: American Immigration Council Data Year 2023.
Colorado's New Americans are educated
Approximately 34.90% of foreign-born Coloradans aged 25 and over have at least a bachelor's degree. These individuals can fill workforce gaps in technically trained professions. Source: ACS Table S0501, 2023 1-year estimate
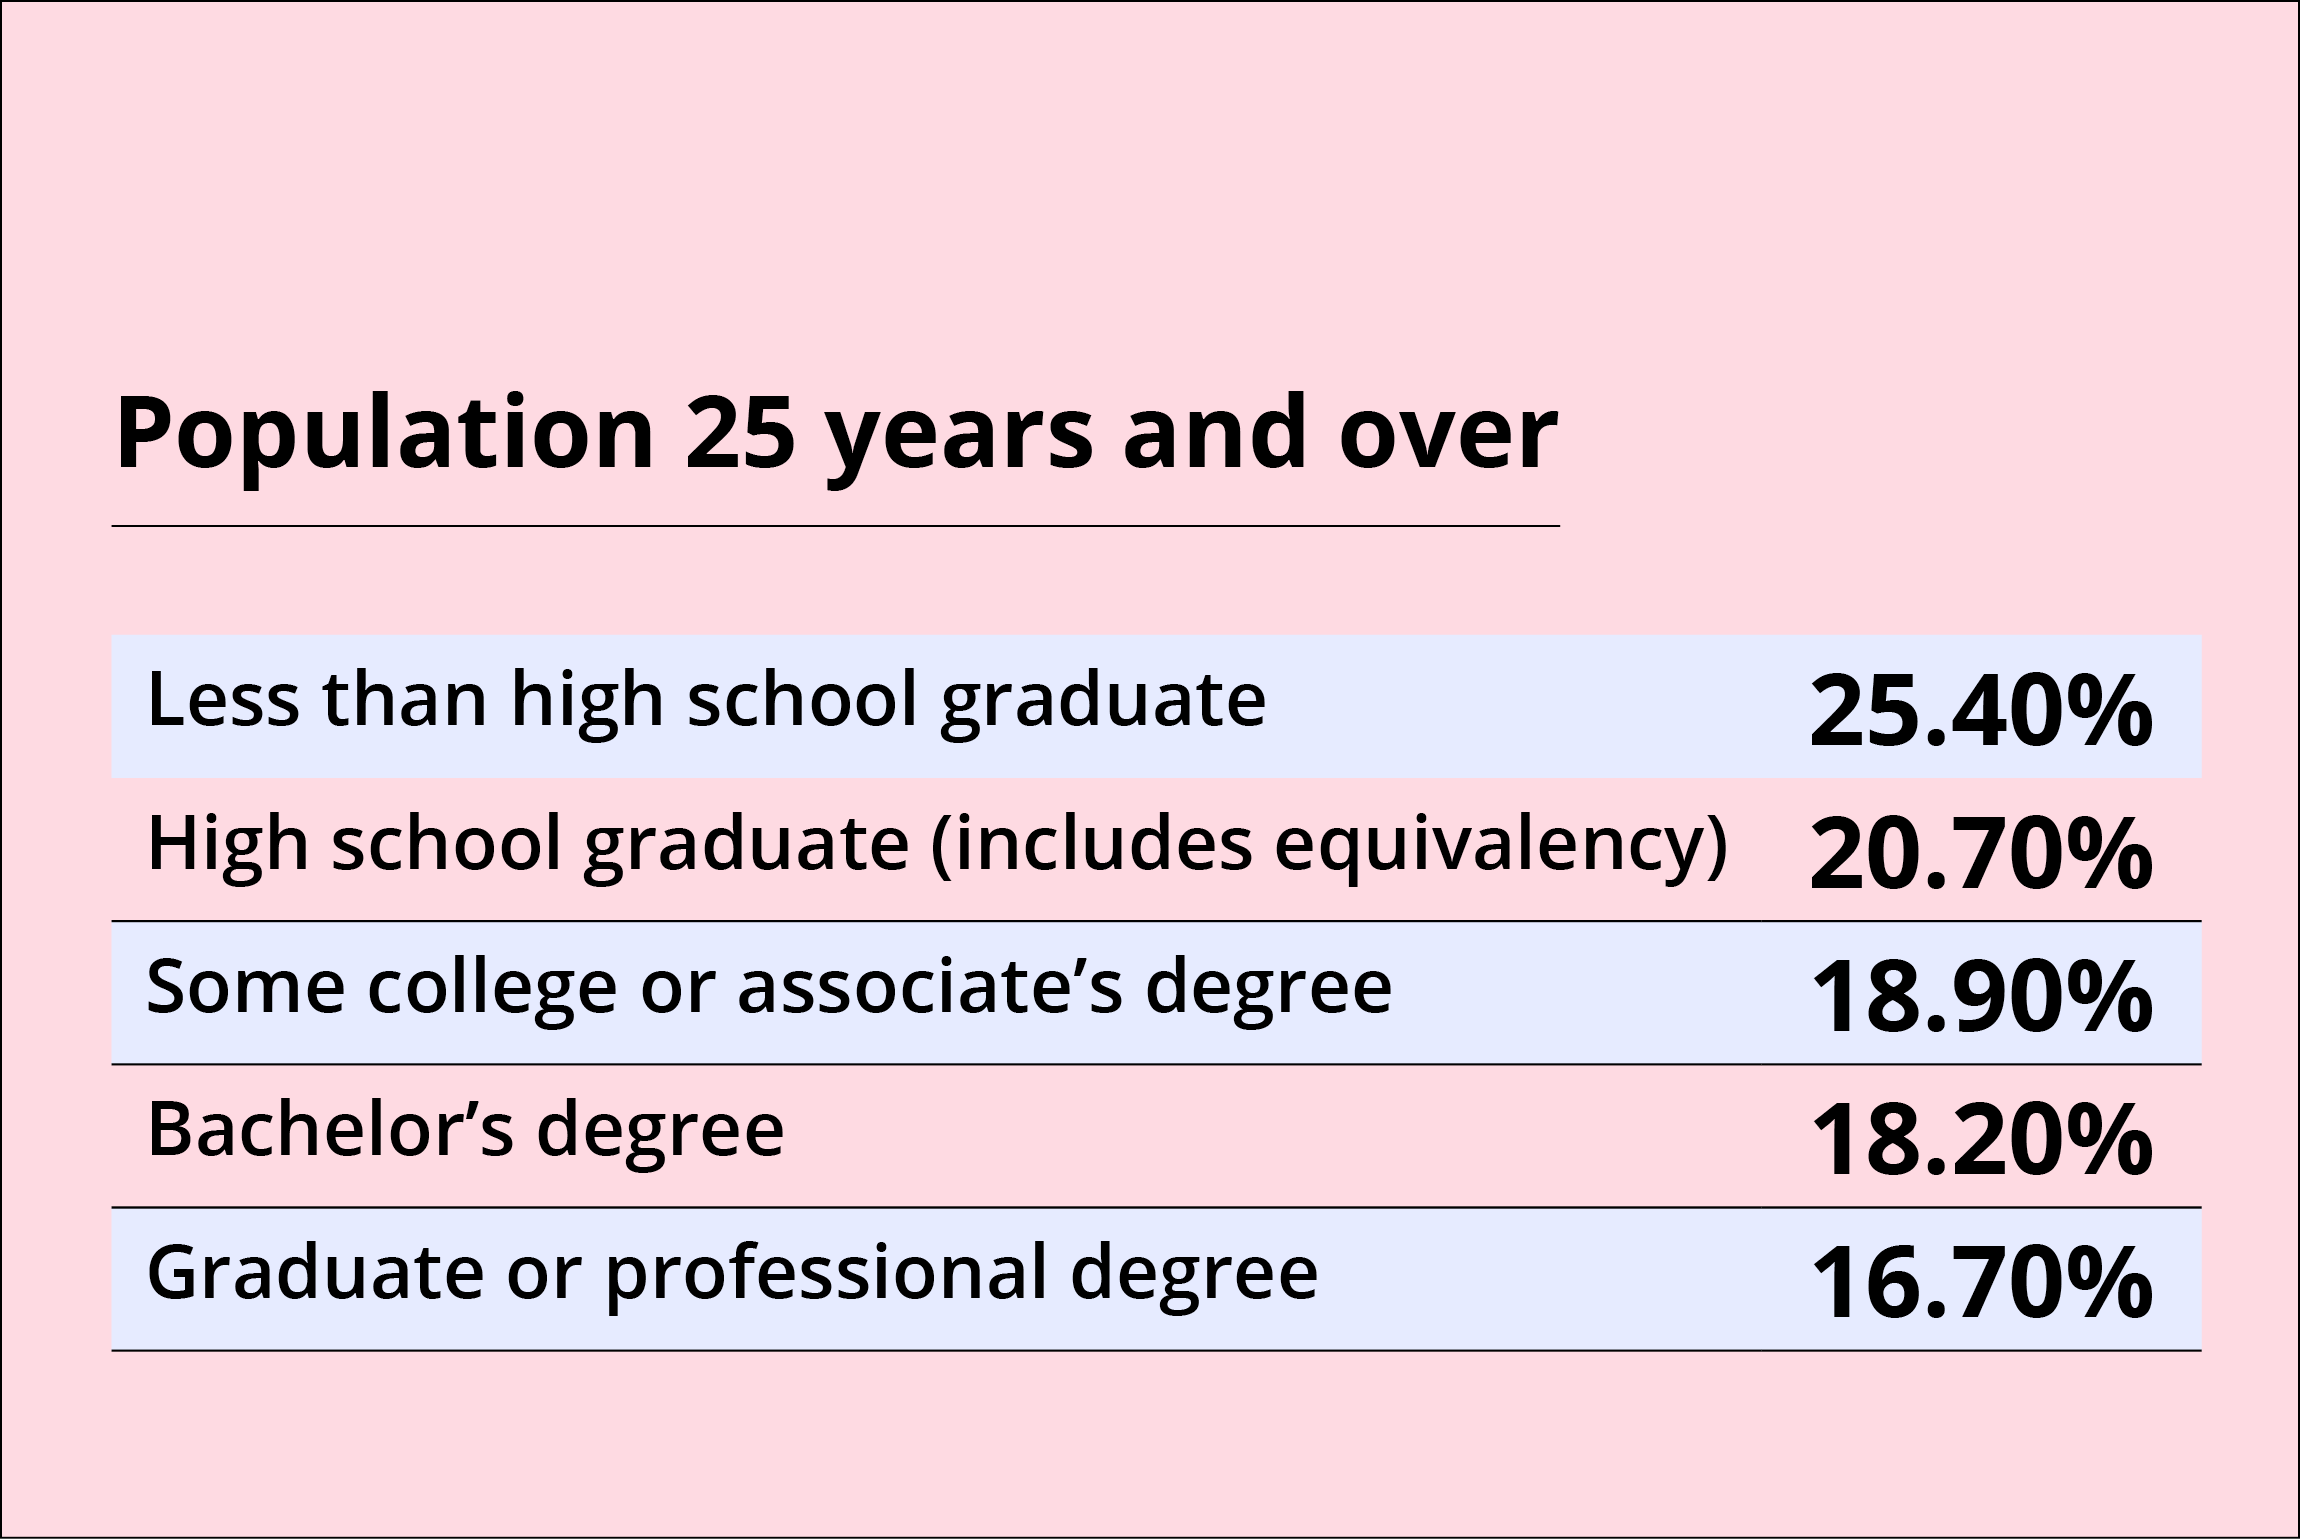
Table showing data of education of population 25 years and over:
Less than high school graduate - 25.40%
High school graduate (includes equivalency) - 20.70%
Some college or associate's degree - 18.90%
Bachelor's degree - 18.20%
Graduate or professional degree - 16.70%
Colorado's New Americans play an important role in the workforce
Foreign-born Coloradans bring diverse skill sets to Colorado's workforce. Colorado immigrants are not a monolith, as reflected by the diverse sectors they work in, from professional, scientific and management industries to arts, retail and construction. Source: ACS Table S0501, 2023 1-year estimate
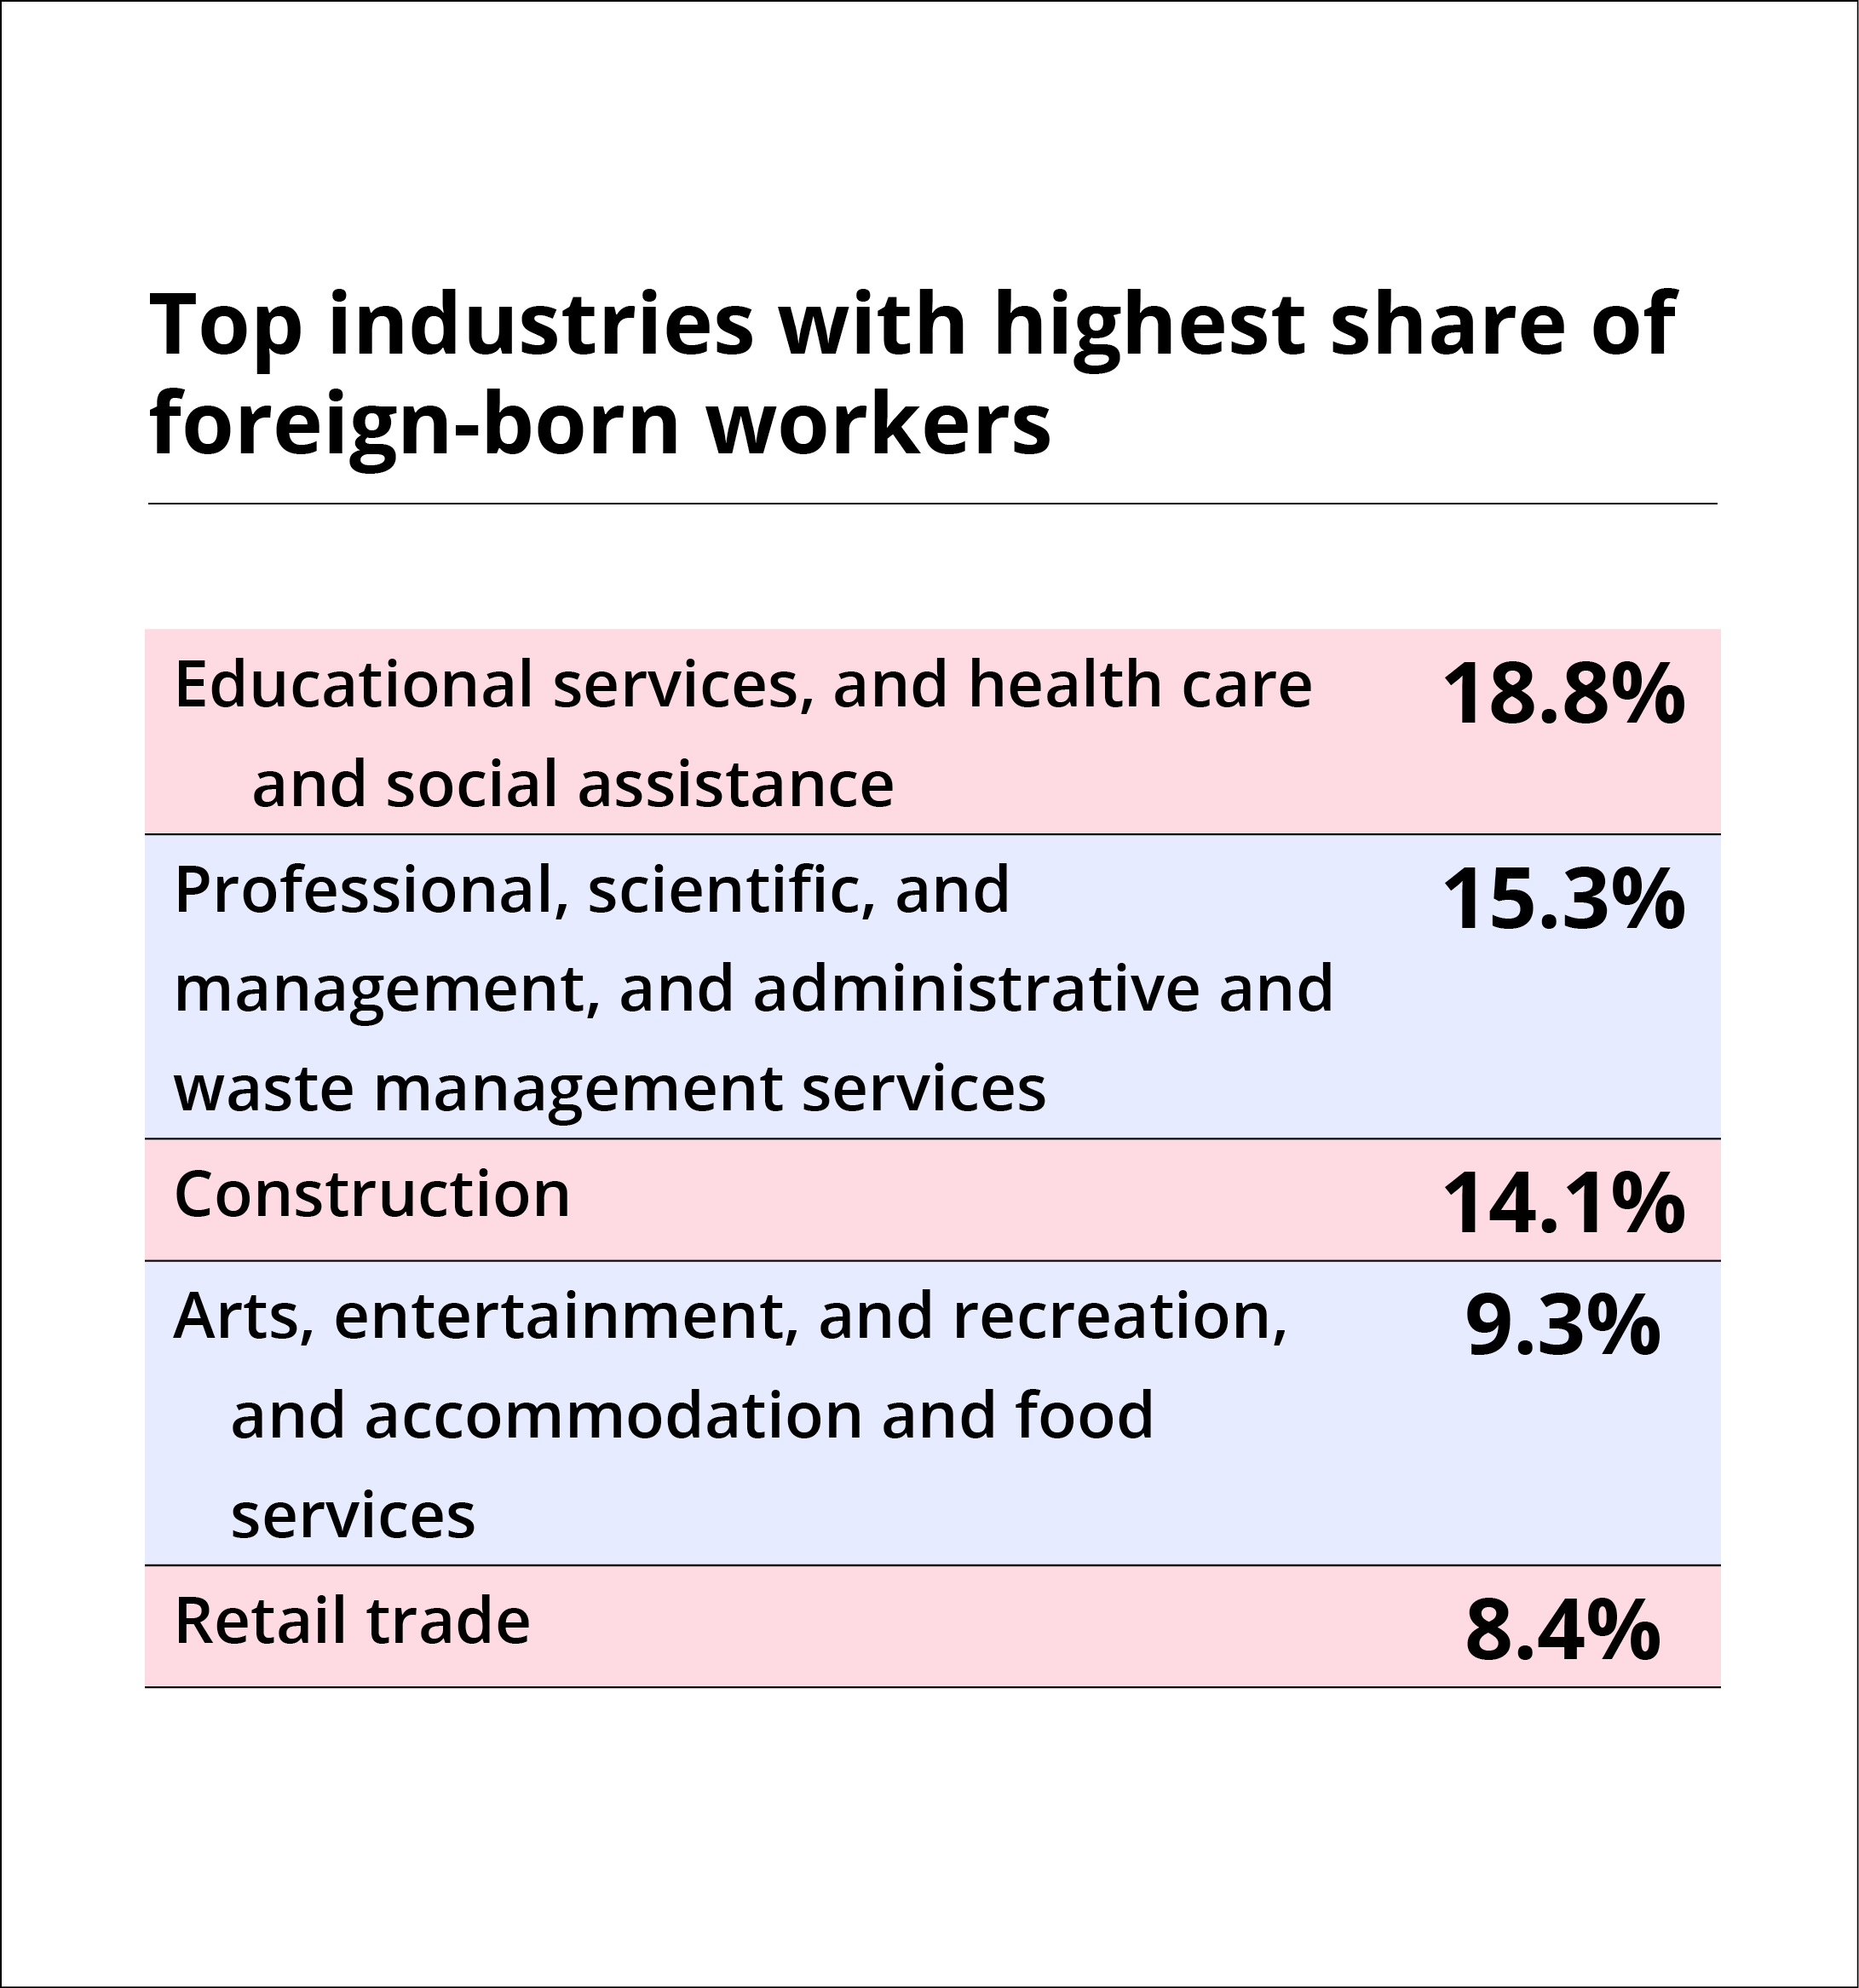
Table showing data of top industries with highest share of foreign-born workers:
1. Educational services, and health care and social assistance - 18.8%
2. Professional, scientific, and management, and administrative and waste management services - 15.3%
3. Construction - 14.1%
4. Arts, entertainment, and recreation, and accommodation and food services - 9.3%
5. Retail trade - 8.4%
Colorado's New Americans represent different genders and family types
This data reflects the gender diversity represented by foreign-born Coloradans. Source: ACS Table S0501, 2023 1-year estimate
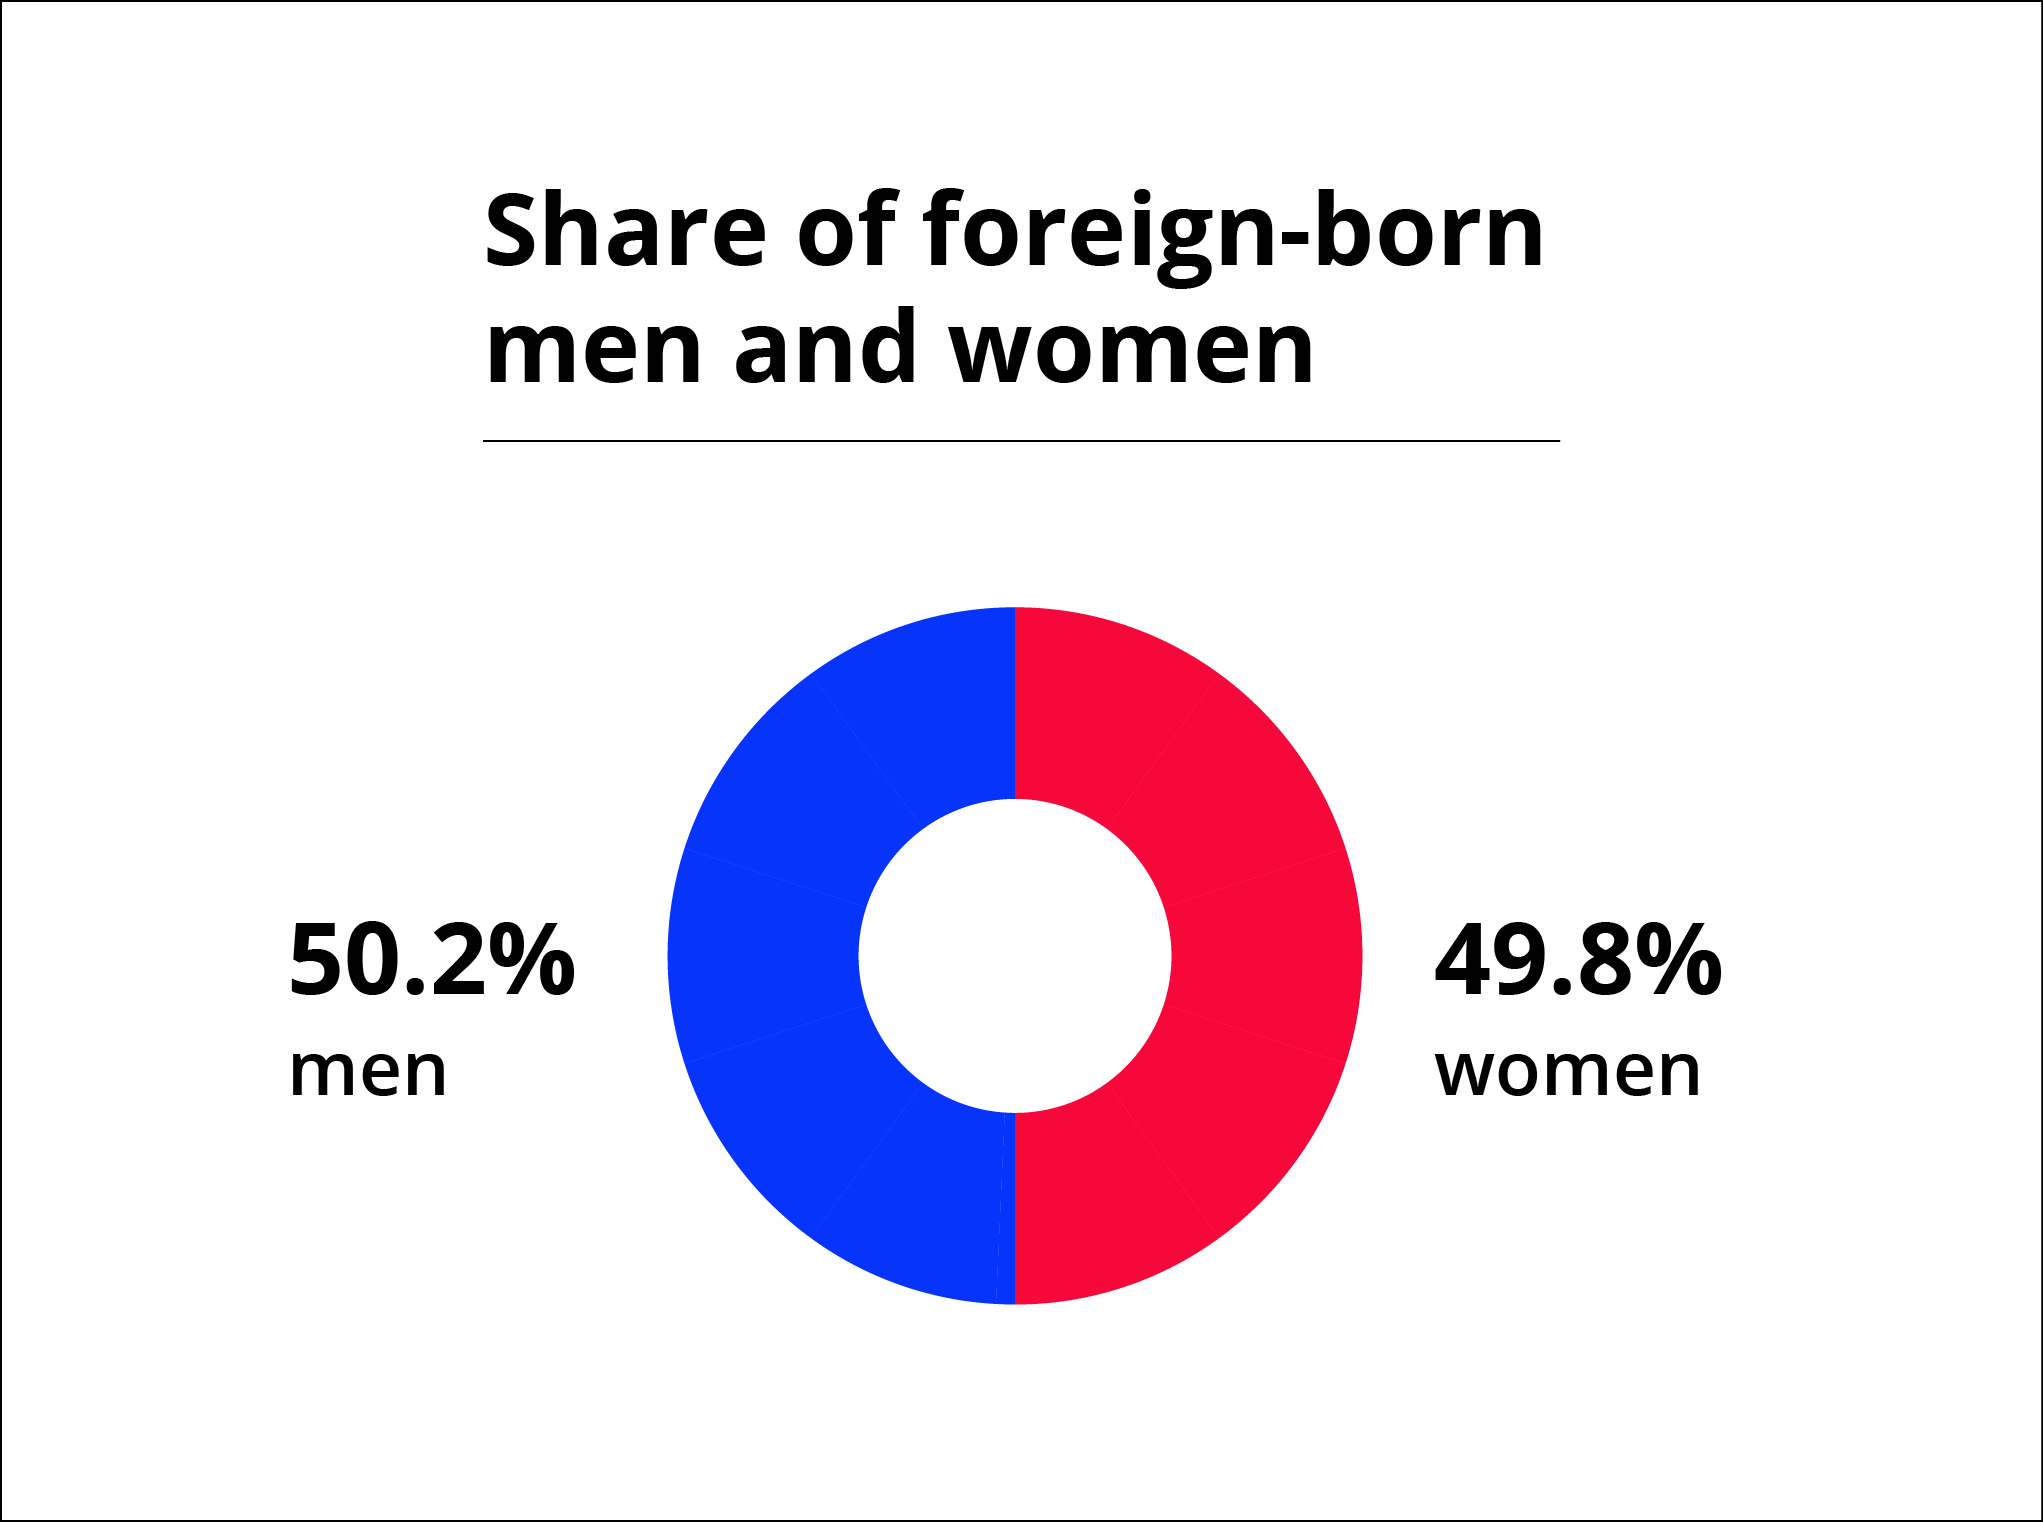
Pie chart showing share of foreign-born men and women: 50.2% men and 49.8% women
Colorado's New Americans speak many languages
Colorado's New Americans speak diverse languages. The benefits of speaking multiple languages include the ability to connect with diverse communities and markets, increased cultural awareness, and sensitivity. These are the top 10 languages according to American Community Survey data collected by the U.S. Census Bureau. In addition to these languages, there are many more languages spoken in Colorado. Source: ACS Table B16001, 2022 5-year estimate
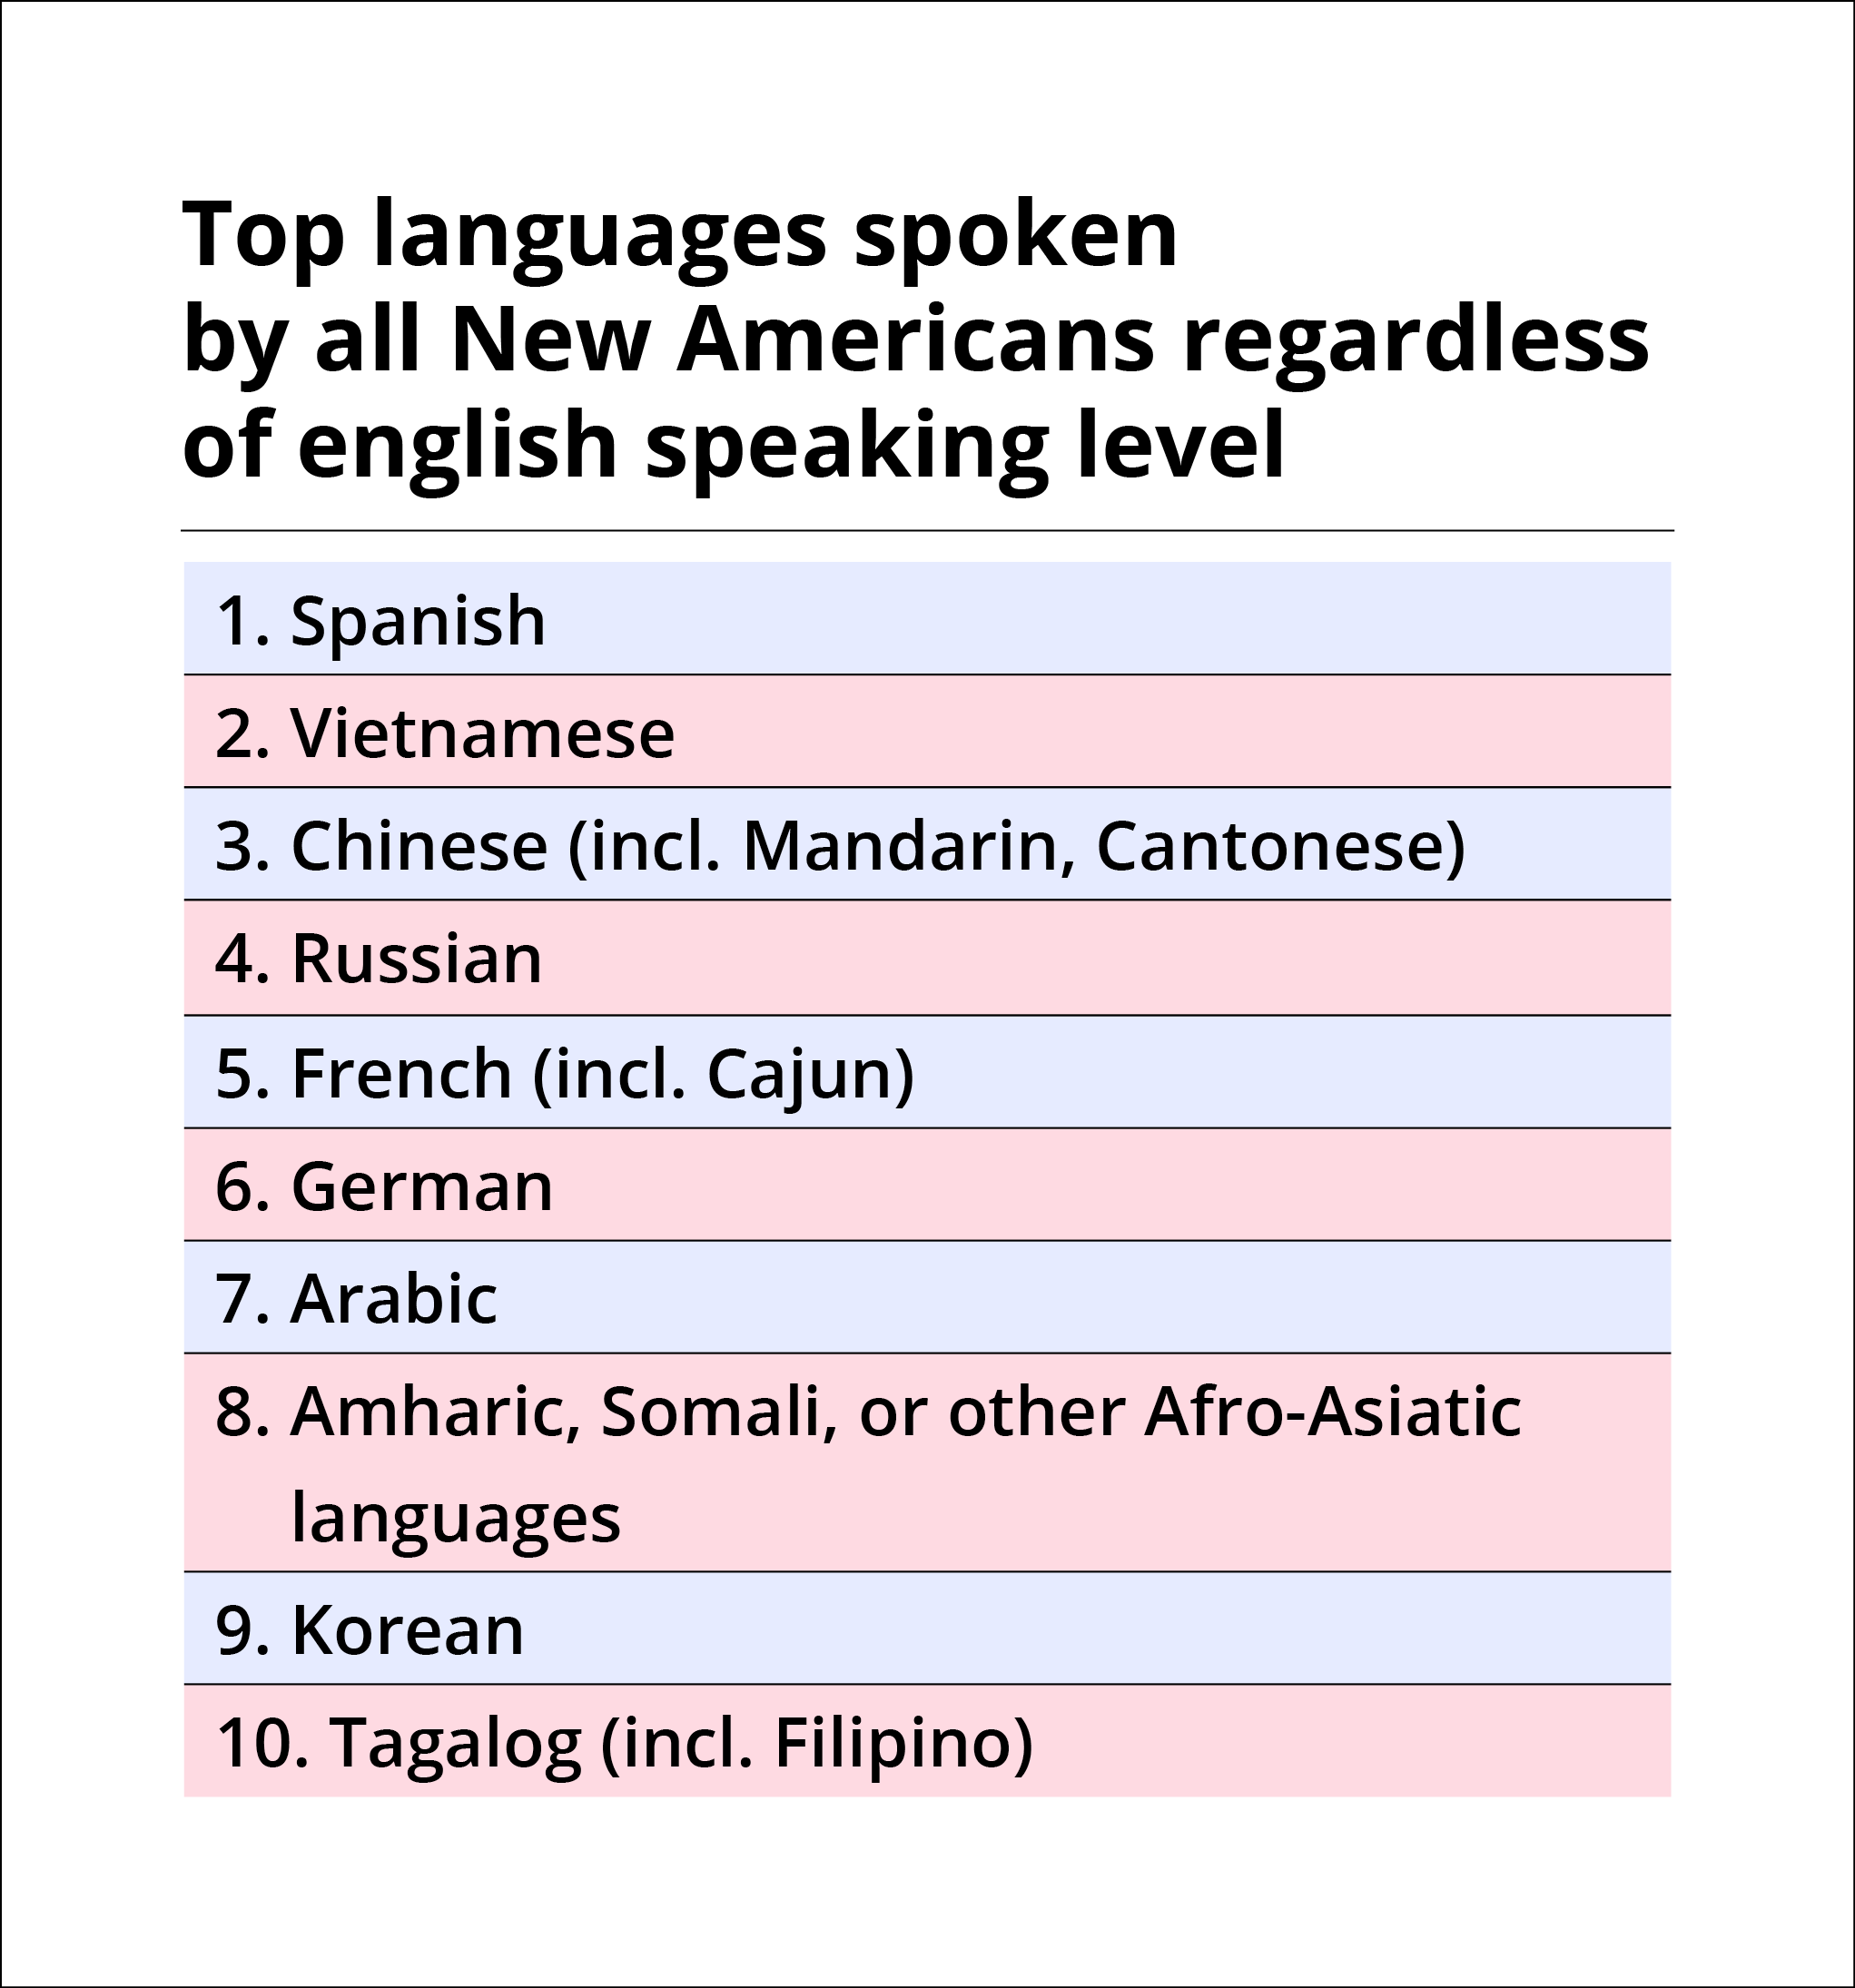
Table showing data of top languages spoken by all New Americans regardless of english speaking level:
1. Spanish
2. Vietnamese
3. Chinese (incl. Mandarin, Cantonese)
4. Russian
5. French (incl. Cajun)
6. German
7. Arabic
8. Amharic, Somali, or other Afro-Asiatic languages
9. Korean
10. Tagalog (incl. Filipino)
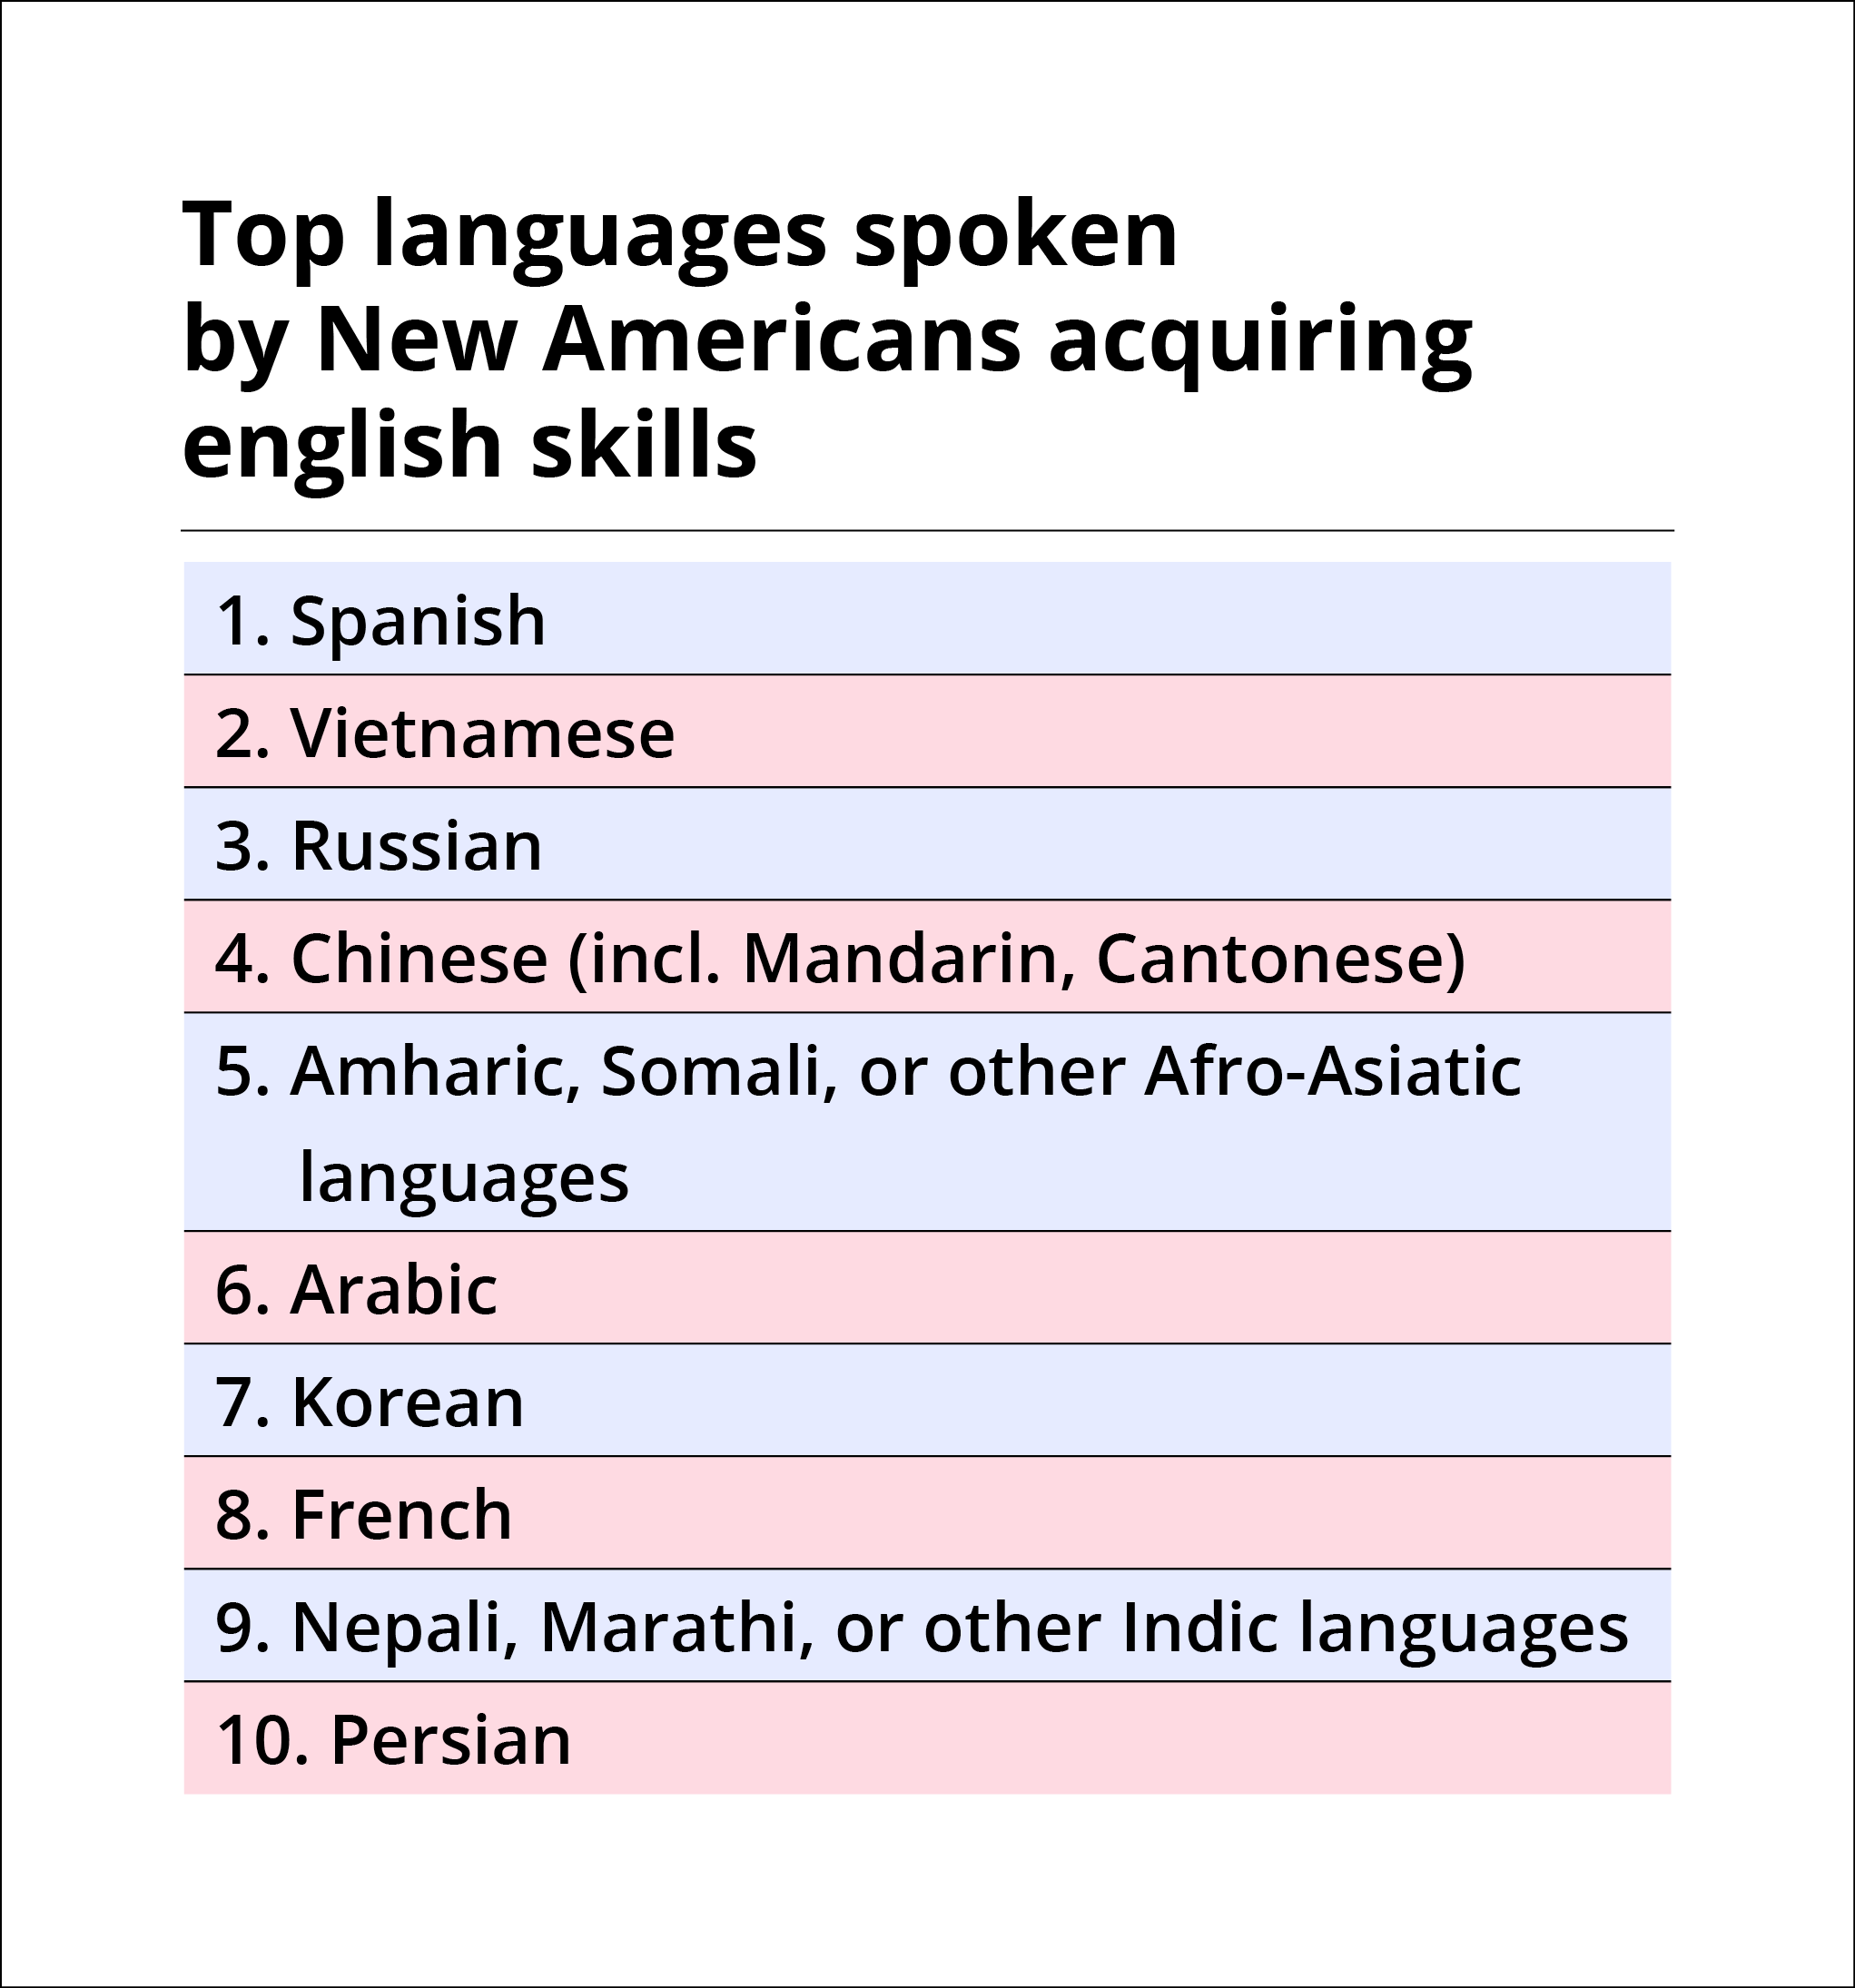
Table showing data of Top languages spoken
by New Americans acquiring english skills:
1. Spanish
2. Vietnamese
3. Russian
4. Chinese (incl. Mandarin, Cantonese)
5. Amharic, Somali, or other Afro-Asiatic languages
6. Arabic
7. Korean
8. French
9. Nepali, Marathi, or other Indic languages
10. Persian
Colorado Refugee Services Year-End Highlights FY 2024
Colorado Refugee Services Year-End Highlights FY 2024 Accessible PDF
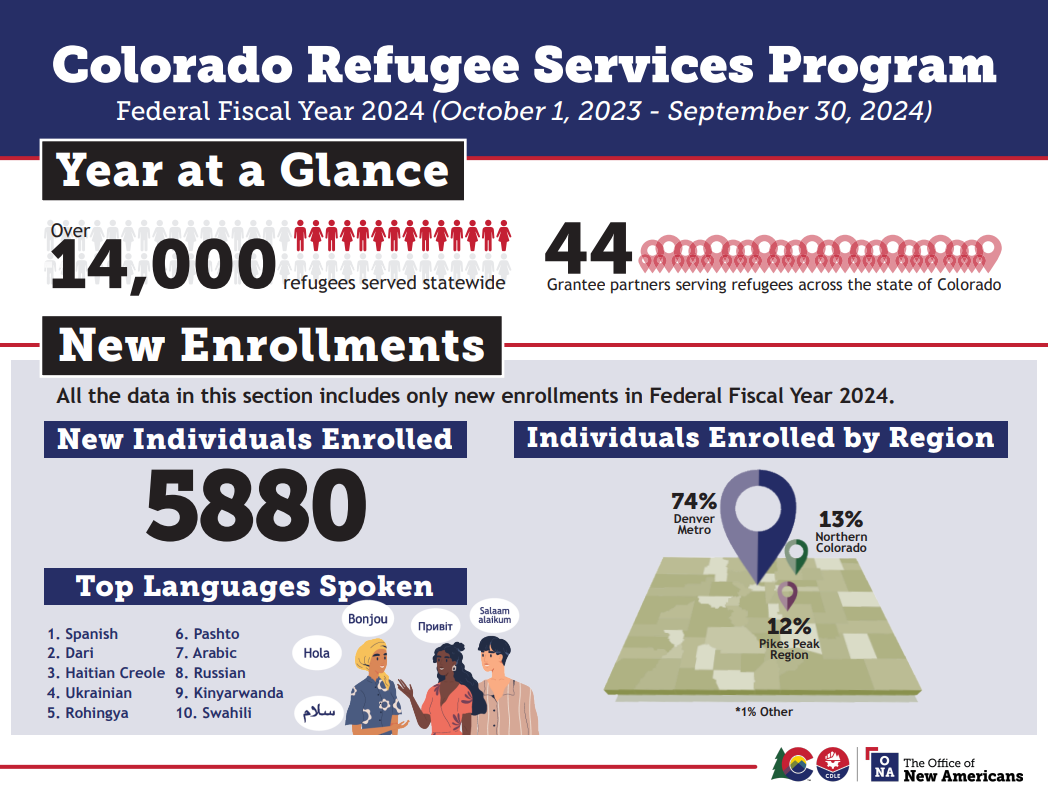
Infographic for FFY2024 showing this data:
Over 14,000 refugees served statewide
44 grantee partners
5,880 New individuals enrolled
Top Languages: 1) Spanish 2) Dari 3) Haitian Creole 4) Ukrainian 5) Rohingya 6) Pashto 7) Arabic 8) Russian 9) Kinyarwanda 10) Swahili
Individuals enrolled by region: Denver Metro - 74%, Northern Colorado - 13%, Pikes Peak Region - 12%, Other - 1%
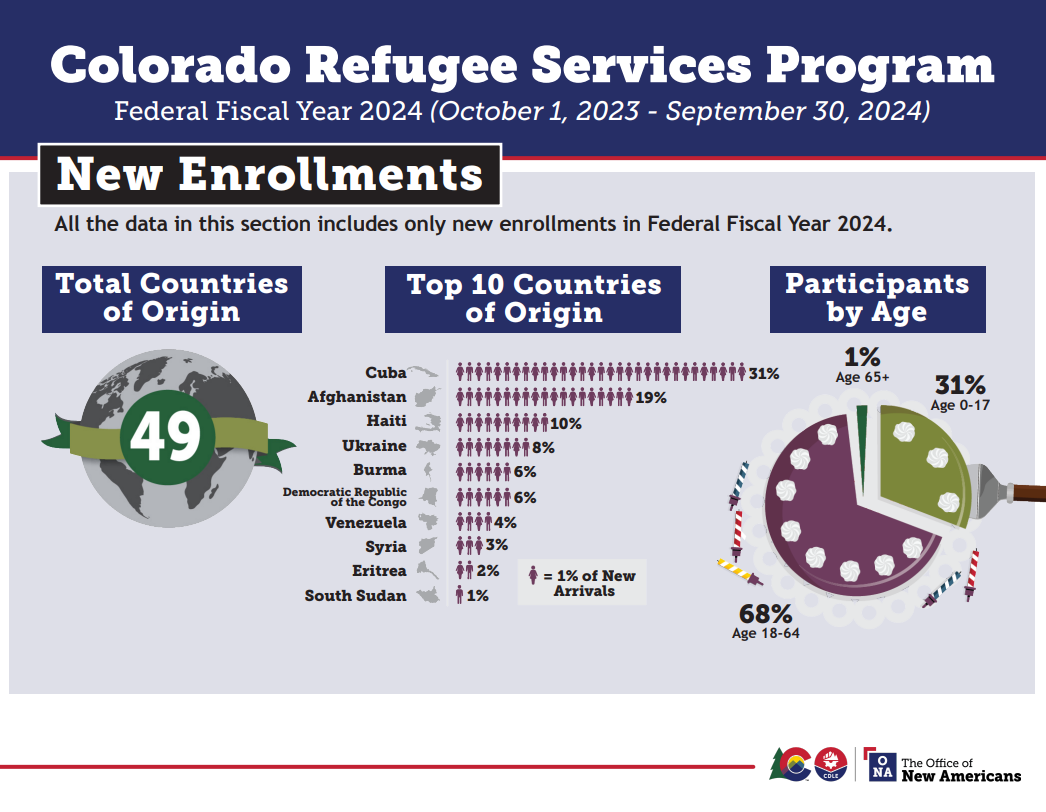
Infographic showing data of New Enrollments in FFY2024:
49 Total Countries of Origin
Top 10 Countries of Origin: 1) Cuba 2) Afghanistan 3) Haiti 4) Ukraine 5) Burma 6) Democratic Republic of Congo 7) Venezuela 8) Syria 9) Eritrea 10) South Sudan
Participants by Age: 31% - 0-17, 68% - 18-64, 1% - 65+
Colorado Refugee Services Year-End Highlights FY 2024 Accessible PDF
Colorado Refugee Services Year-End Highlights FY 2023 Accessible PDF
Colorado Refugee Services Year-End Highlights FY 2022 Accessible PDF
Colorado Refugee Services Year-End Highlights FY 2021 Accessible PDF
Colorado Refugee Services Year-End Highlights FY 2020 Accessible PDF
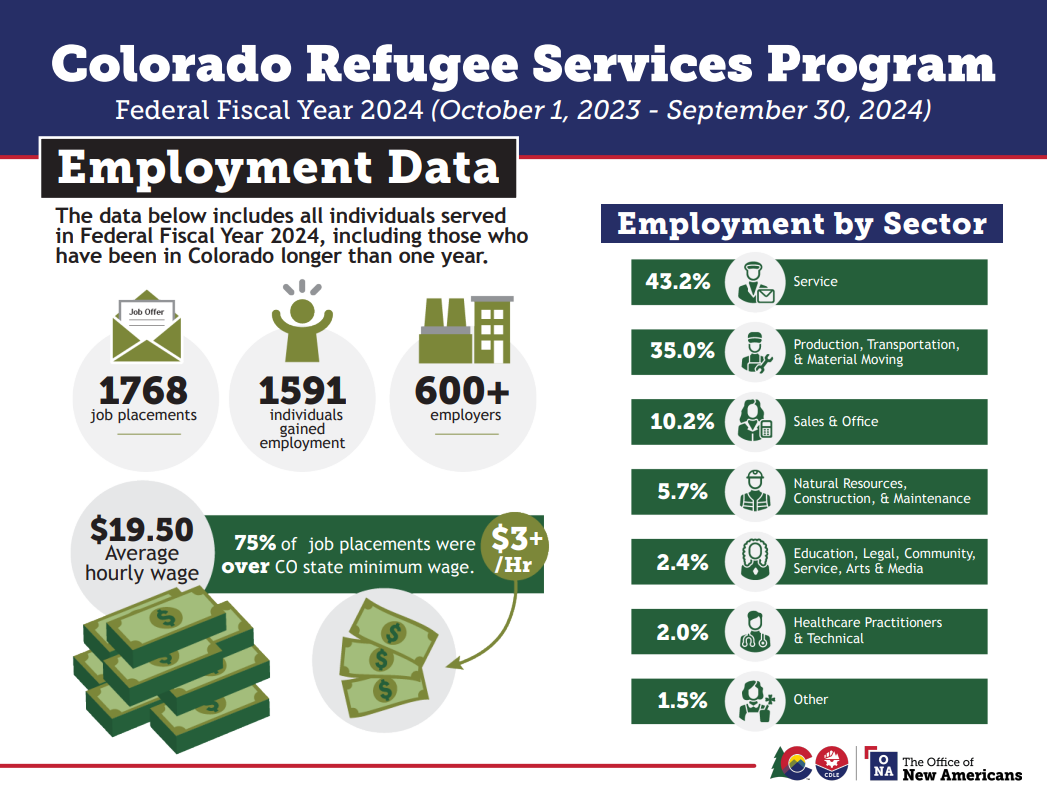
Employment data showing all individuals served in FFY 2024, including individuals in Colorado for more than one year.
1768 Job Placements
1591 Individuals Gained Employment
600+ Employers
$19.50/hr. Average Wage
75% of Job Placements were $3/hr.+ over state minimum wage.
Sector Distribution of Jobs: 43.2% - Service, 35% - Production, Transportation and Material Moving, 10.2% - Sales and Office, 5.7% - Natural Resources, Construction and Maintenance, 2.4% - Education, Legal, Community Service, Arts and Media, 2% - Healthcare Practitioners & Technical, 1.5% - Other.